Annals of Cardiology and Vascular Medicine
HOME /JOURNALS/Annals of Cardiology and Vascular Medicine- Research Article
- |
- Open Access
- |
- ISSN: 2639-4383
The Most Cited Articles, Authors, Journals, and the Affiliated Countries on the Topic of Cardiology from 2016 to 2018 in Pubmed Central
- Shu-Chen Hsing;
- Department of Respiratory Therapy, Chi-Mei Medical Center, Taiwan
- Tsair-Wei Chien;
- Research Department, Chi-Mei Medical Center, Tainan, Taiwan
- Willy Chou*;
- Department of Physical Medicine and Rehabilitation, Chung Shan Medical University, Taichung, Taiwan
- Department of Physical Medicine and Rehabilitation, Chiali Chi Mei Hospital, Tainan, Taiwan
- Hsiu-Yu Lai
- Department of Physical Medicine and Rehabilitation, Chiali Chi Mei Hospital, Tainan, Taiwan

| Received | : | May 25, 2020 |
| Accepted | : | Jun 18, 2020 |
| Published Online | : | Jun 22, 2020 |
| Journal | : | Annals of Cardiology and Vascular Medicine |
| Publisher | : | MedDocs Publishers LLC |
| Online edition | : | http://meddocsonline.org |
Cite this article: Shu-Chen H, Tsair-Wei C, Chou W, Hsiu-Yu L. The Most Cited Articles, Authors, Journals, and the Affiliated Countries on the Topic of Cardiology from 2016 to 2018 in Pubmed Central. Ann Cardiol Vasc Med. 2020: 3(1); 1017.
Abstract
Objective: To apply the citation analysis to the pattern of international author collaborations on the topic of cardiology from PubMed Central (PMC) and to visualize the results using Google Maps and the Kano model.
Methods: We obtained 1396 abstracts on September 27, 2019, from PMC based on the keywords of cardiology in title from 2016 to 2019. The author names, countries, and keywords were recorded. We also investigated following features: (1) nation distribution for 1st authors in article bylines; (2) eminent authors on cardiology, (3) the most popular journals and the article, and (4) the kano diagrams to display the characteristics of influential research achievements in PMC on cardiology. We programmed Microsoft Excel VBA routines to extract data from PMC. Google Maps and the Kano model were performed to display the graphical representations with an easy-to-read feature for readers. The bibliometric x-index was computed to measure the research achievements.
Results: We found that (1) the most number of papers on the topic of cardiology is from the United States(311,29.37%) and Italy (84,7.93%); (2) the most cited countries, authors, and the journals are from Poland, Piotr Ponikowski(Poland), and Eur Heart J.
Conclusions: Kano diagrams on Google Maps with citation analyses provide wide and deep insight into the relationships on authors’ publications and citations. The results can provide readers with knowledge and concept diagram for the future submissions to journals and authors referred to the topic of cardiology.
Keywords: Cardiology; PubMed central; Google Maps; Kano model; Visual basic for application.
Abbreviations: AWS: Weighted Author Scheme; IRA: Individual Research Achievement; PMC: PubMed Central; VBA: Visual Basic for Application
Introduction
Cardiology is a branch of medicine that deals with the disorders of the heart as well as some parts of the circulatory system for human beings [1-5]. The field includes medical diagnosis and treatment of congenital heart defects, coronary artery disease, heart failure, valvar heart disease and electrophysiology [6-8]. Physicians who specialize in this field of medicine are called cardiologists as a specialty of internal medicine. Similarly, pediatric cardiologists are pediatricians who specialize in cardiology. Alternatively, physicians who specialize in cardiac surgery are called cardiothoracic surgeons or cardiac surgeons as a specialty of general surgery.
Although the cardiovascular system is inextricably linked to blood, cardiology is relatively unconcerned with hematology and its diseases [9,10]. Some obvious exceptions that affect the function of the heart would be blood tests (electrolyte disturbances, troponins), decreased oxygen-carrying capacity (anemia, hypovolemic shock), and coagulopathies [11-14].
Many previous types of research [15-17] have inspected the patterns of coauthor collaboration in the past in literature. The most number of articles in science are from the U.S. and Europe [18,19]. Whether the dominant nation on the topic of cardiology is similar to other science is worthy of study and investigation.
As of September 20, 2019, more than 189 papers were published on PubMed Central (PMC) by searching the keyword cardiology and citation in abstracts. However, none has incorporated bibliometric and Kano diagram [20] to compare the Individual Research Achievements (IRAs) for authors and affiliated countries on Google Maps. We are motivated to investigate the IRAs on cardiology regarding articles published in PMC.
Choropleth maps (the ones in which each region is filled with a color that represents a value) have been reported in the past [19,21-23], particularly the Google Map API (application for program interface) [24,25] has been popular in the digital age. Furthermore, the Kano model [5] has been successfully applied to classify the featured qualities for each product in the past. Whether the Kano model can be used for measuring the IRAs for authors or affiliated countries in citation analyses is a challenge to the current study.
We are thus interested in following four topics: (1) which nations were dominant in the field of cardiology; (2) which authors were cited most in recent years; (3) which journals earn the prominent IRAs on cardiology; (4) which article was cited most in the past.
We aim to apply x-index [26] to investigate the four questions mentioned above. Google Maps will be applied to the study results as dashboards in an interactive way.
Methods
Data source
We obtained 1396 abstracts based on journal article from PMC by searching the keywords of “cardiology” [Title] from 2016 to 2019 as of September 20, 2019. A total number of 12789 citing articles matching the citable papers in PMC were attained. The number of 559 articles was cited by at least one publication in PMC. All data were downloaded from PMC, which means the study is not necessary for ethical approval according to the regulation promulgated by the Taiwan Ministry of Health and Welfare.
The x-index proposed in this study
The x-index  [26] can be divided into three parts: toward citation, neutral and the publications, which is suitable for using Kano model to display.
The weighted author scheme (AWS) for quantifying coauthor contributions
One of the drawbacks for h-index was proposed without fairly quantifying coauthors’ credits in an article byline [27,28]. Many bibliometric indices ignore the coauthor contributions to the article with an equal credit size. For instance, some used the alphabet ordering of author names [29] in the mathematical discipline and assumed all coauthor with equal credits, we particularly applied the author-weighted scheme [30,31], i.e.,

to this study for quantifying coauthor contributions, where m-1 is the number of authors in an article byline, the first author has the most credit with the power γ = m—1, the corresponding author placed at the last position has the second larger credit with the power γ = m—2 last one has the power γ= 0
Kano model used in this study
The Kano model [20] is applied to classify the IRA features for each entity, all author-based x-indexes with similar quantities of citations and publications will locate on the one-dimension zone. That is the plot along a 45-degree line that runs from the left-bottom to the right-top. Otherwise, the IRAs will be on either the upper side or bottom side in the Kano diagram. That is to say that if the x-index [26] is applied to the Kano model, the other two features of the citation-oriented and the production-oriented might be highlighted in the draw when the publications (i) are on the X-axis and citations (ci) on the Y-axis. As a result, the x-index is truly suitable for Kano model [20] in the assessment of entity IRA characteristics.
Creating dashboards on Google Maps
We applied the author-made modules in MS-Excel and the Kano diagrams to draw dashboard on Google Maps. The pages of Hyper Text Mark-up Language (HTML) used for Google Maps were created. All relevant bibliometric indices were linked to dashboards on Google Maps.
Results
TASK 1: Which countries/areas dominate the topic of cardiology around the world
We observed the most number of papers on the topic of cardiology are from the United States (311,29.37%) and Italy (84,7.93%), see Table 1 based on the first authors whose affiliated countries/areas are listed in the corresponding abstract.
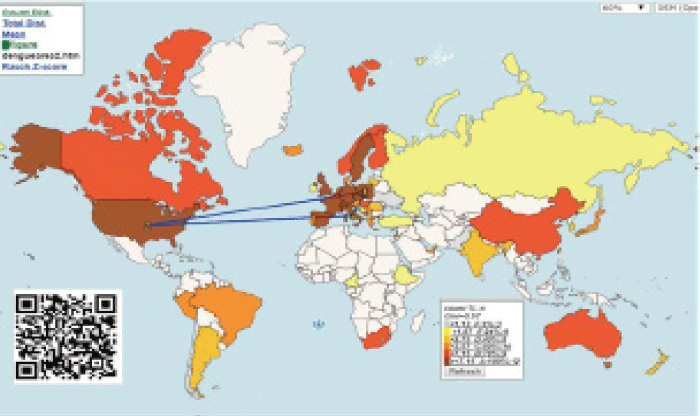
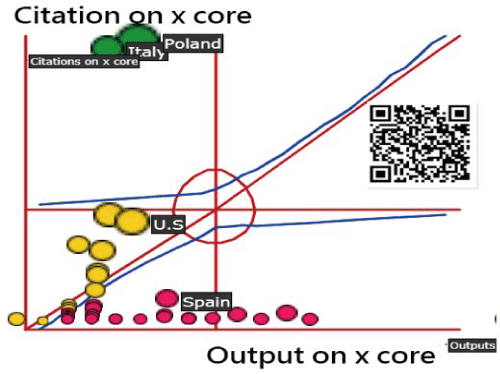
The most cited countries using the x-index to measure are Poland, the US, and Italy, see Figure 1 with a choropleth map to present. The Kano diagram in Figure 2 clearly and definitely displays that the citation-originated countries are Polan and Italy, the US is located in the one-dimensional region and Spain in the publication-originated area.
Figure 1: The most cited affiliated countries/areas on cardiology in PubMed using x-index to measure (Poland, the US, and Italy)
Figure 2: The most affiliated countries/areas on cardiology in PubMed using x-index to display on the Kano diagram.
TASK 2: selecting the most cited authors
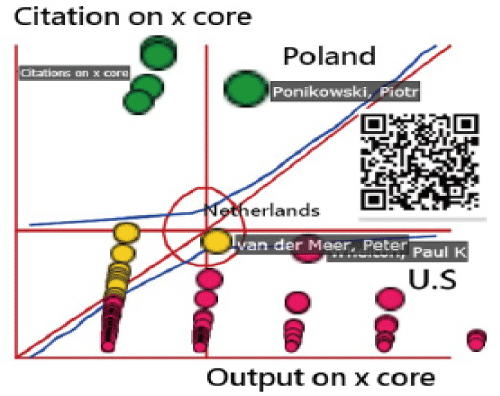
The most cited author are (1) Piotr Ponikowski form Poland with x-index= 25.84, Cited=333.76, and Citable=2; (2) Peter van der Meer from the Netherlands with x-index=15.67, Cited=122.78, and Citable=2. Others can be seen in Figure 3 when QR-code has been scanned and clicked on the bobble of interest.
TASK 3: selecting the most cited authors
The most cited author are (1) Piotr Ponikowski form Poland with x-index= 25.84, Cited=333.76, and Citable=2; (2) Peter van der Meer from the Netherlands with x-index=15.67, Cited=122.78, and Citable=2. Others can be seen in Figure 3 when QR-code has been scanned and clicked on the bobble of interest.
TASK 4: The most cited article
The most cited article regarding cardiology is the one [32] with the number of citations = 883 in PMC till September 27, 2019. The article is related to the written guidelines on cardiology for the diagnosis and treatment of acute and chronic heart failure linked at https://www.ncbi.nlm.nih.gov/pubmed/?term=27206819
Discussion
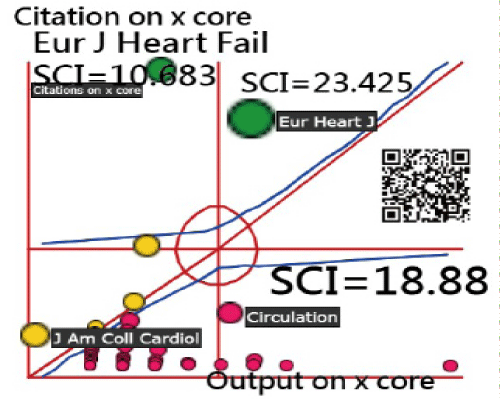
We observed that (1) the most number of papers on the topic of cardiology are from the the United States (311,29.37%) and Italy (84,7.93%); (2) the most cited countries, authors, and the journals are from Poland, Piotr Ponikowski (Poland), and Eur Heart J.
As for the h-index [33], an author-level metric that attempts to measure both the productivity and citation impact of the publications of a scientist or scholar, proposed for determining IRA, both citations and publications should be combined, as h-index and other complementary metrics, to determine the IRA. However, the newest bibliometric index is the x-index [26] proposed in 2018. The first feature in this study is that we demonstrated the x-index sophisticatedly applied to measure IRAs for authors and affiliated countries/areas because the x-index can clearly indicate the attributes in tree parts better understanding the properties of the IRA for entities than other bibliometric [30,31], see Figures from 2 to 4.
Another feature in this study is about the choropleth maps applied to present the results, see Figure 1, which imply that choropleth maps are great to show a clear regional pattern for the disparity of the data. If our data doesn’t show a clear regional pattern, consider other chart types, e.g., bar chart or line chart, readers would prefer to find themselves on a map. If we are mapping an area in which our readers live, do consider a choropleth map even if they do not live in those regions [34]. Accordingly, the top two countries of Poland and Italy are most in x-index, particularly on citation-originated in Kano diagram on cardiology by the keyword “cardiology [Title] in PMC.
The most cited author is Piotr Ponikowski form Poland who gains x-index= 25.84, Cited=333.76 using the x-index to measure the IRAs which can fairly allocate credits in an article. Otherwise, all coauthors who enjoy an equal size of contributions to the article are unfair when calculating the bibliometrics [27, 28].
A total of 233 articles were extracted from PMC using the keyword “most cited articles” in the paper title. Only four [35-38] referred Pubmed as the citations database. Other famous major citation databases, such as the Scientific Citation Index (SCI; Thomson Reuters, New York, NY, USA) and Scopus (Elsevier, Amsterdam, The Netherlands), are paid for use [39]. We applied the web crawler technique and obtained the citations from PMC, which is rarely seen in the previous research. The most cited article with PMID= 27206819 in 2016 was, thus found. A total of 883 citations was extracted from PMC.
Although the h-index [33] being a popular author-level metric that can measure both the productivity and citation impact of the publications of a scientist, one of its shortcomings is less discriminative power [40] was criticized. Even the h-plus index is proposed to complement the h-index because both parts of excess and h-tail citations have been considered [41,42], the x-index [26], particularly incorporated with the Kano model, is the best for better understanding the IRAs on a diagram according to the findings in the current study.
Another feature is about the AWS used for quantifying coauthor contributions in an article byline. Even many concepts have already been proposed in the past [27,28,43], but none has been applied to the scientific disciplines in use successfully as we did with the Eq. (1).
The reason we applied x-index in this study is the strength of the index in practice. According to the illustration in the study of Fenner and his colleagues [26], the x-index can truly extend the feature of an author with quality and quantity achievements in academics as mentioned above.
Although findings are based on the above analysis, there are still several potential limitations that may encourage further research efforts. First, all data were extracted from PMC. There might be some biases when matching author names because of some with identical names, which will affect the result of author clusters.
Second, many definitions that can be determined on the topic of cardiology. We merely applied the keyword “cardiology [Title] in this study. The findings regarding the most cited counties, authors, journals or the articles cannot be generalized to the true topic of cardiology. The future studies are encouraged to broaden the definition as to completely investigate the true IRAs on cardiology.
Third, the data extracted from PMC cannot be generalized to other major citation databases. Such as the most cited articles and authors might be disparate if others were applied.
Conclusion
In conclusion, Kano diagrams on Google Maps with citation analyses provide wide and deep insight into the relationships on authors’ publications and citations. The results can provide readers with knowledge and concept diagram for the future submissions to journals and authors referred to the topic of cardiology.
Authors' Contributions
HYL developed the study concept and design. TWC and HYL analyzed and interpreted the data. WC monitored the process of this study and helped in responding to the reviewers’ advice and comments. TWC drafted the manuscript, and all authors provided critical revisions for important intellectual content. The study was supervised by WC. All authors read and approved the final manuscript.
Acknowledgments
We thank Enago (www.enago.tw) for the English language review of this manuscript. All authors declare no conflicts of interest.
References
- Cugno M, Depetri F, Gnocchi L, Porro F, Bucciarelli P. Validation of the Predictive Model of the European Society of Cardiology for Early Mortality in Acute Pulmonary Embolism. TH Open. 2018; 6; 2: 265-271.
- Agarwal A, Huffman MD, Reddy KS, Prabhakaran D. American College of Cardiology/ American Heart Association Clinical Practice Guideline for Blood Pressure: Implications for India. 2017.
- Mihaela Micheu M, Udrea OM, Octavia Popa M, Rusu I, Gheorghe-Fronea O, et al. The Attitude of Patients from a Romanian Tertiary Cardiology Center as Regards Participation in Biomarker-Based Clinical Trials - Survey Methodology. J Med Life. 2018; 11: 320-327.
- Dillinger J G, Henry P. What’s new regarding aspirin in cardiology? Rev Prat. 2018; 68: 587-590.
- Giguere P, Nhean S, Tseng AL, Hughes CA, Angel JB. Getting to the Heart of the Matter: A Review of Drug Interactions Between HIV Antiretrovirals and Cardiology Medications. Can J Cardiol. 2019; 35: 326-340.
- Roohafza H, Sadeghi M, Khani A, Behnamfar O, Afshar H,et al. Patient competence in relation with medical and psychosocial characteristics in cardiology context: A cross-sectional study. ARYA Atheroscler. 2018; 14: 196-204.
- Corre J, Douard H. Rationalization of biological tests in cardiology department. Sante Publique. 2018; 30: 689-695.
- Neidenbach R, Niwa K, Oto O, Oechslin E, Aboulhosn J, et al. Improving medical care and prevention in adults with congenital heart disease-reflections on a global problem-part I: development of congenital cardiology, epidemiology, clinical aspects, heart failure, cardiac arrhythmia. Cardiovasc Diagn Ther. 2018; 8: 705-715.
- Bavaria JE, Tommaso CL, Brindis RG, Carroll JD, Deeb GM, et al. AATS/ACC/SCAI/STS Expert Consensus Systems of Care Document: Operator and institutional recommendations and requirements for transcatheter aortic valve replacement: A joint report of the American Association for Thoracic Surgery, J Thorac Cardiovasc Surg. 2018; S0022-5223; 31796-3.
- Izquierdo Gonzalez R, Dorrego Garcia RM, Rodriguez Ledo P, Segura Heras JV. Screening based on risk factors for abdominal aortic aneurysm in the cardiology clinic. Int J Cardiol. 2019; 279: 162-167.
- Mosepele M, Regan S, Massaro J, Meigs JB, Zanni MV, et al. Impact of the American College of Cardiology/American Heart Association Cholesterol Guidelines on Statin Eligibility Among Human Immunodeficiency Virus-Infected Individuals.
- Dudek D, Siudak Z, Legutko J, Araszkiewicz A, Bil J, et al. Percutaneous interventions in cardiology in Poland in the year 2017. Summary report of the Association of Cardiovascular Interventions of the Polish Cardiac Society AISN PTK and Jagiellonian University Medical College. Postepy Kardiol Interwencyjnej. 2018; 14: 422-424.
- Khan MS, Usman MS, Siddiqi TJ, Ayub MT, Fatima K, et al. Women in Leadership Positions in Academic Cardiology: A Study of Program Directors and Division Chiefs.
- Haleem A, Javaid M, Saxena A. Additive manufacturing applications in cardiology: A review. Egypt Heart J. 2018; 70: 433-441.
- Liu X, Bollen J, Nelson ML, Van de Sompel H. Co-authorship networks in the digital library research community. Info Process Manag. 2005; 41: 1462- 1480.
- Leydesdorff L, Wagner C, Park HW, Adams J. International collaboration in science: the global map and the network.CoRR abs/1301.0801 .2013.
- Glänzel W, Schlemmer B. National research profiles in a changing Europe (1983–2003) An exploratory study of sectoral characteristics in the Triple Helix. Scientometrics. 2007; 70: 267-275.
- Gao K, Tian G, Ye Q, Zhai X, Chen J, et al. Papers published from 1995 to 2012 by six Traditional Chinese Medicine universities in China: a bibliometric analysis based on science citation index. J Tradit Chin Med. 2013; 33: 832-844.
- Goovaerts P. A coherent geostatistical approach for combining choropleth map and field data in the spatial interpolation of soil properties.Eur J Soil Sci. 2011; 62: 371-380.
- Kano N, Seraku N, Takahashi F, Tsuji S. Attractive Quality and Must-Be Quality. Journal of the Japanese Society for Quality Control 1984; 41: 39-48.
- JB, Ledford K, Royalty J.Choropleth map design for cancer incidence, part 2.Prev Chronic Dis. 2010; 7: A24. Epub 2009.
- Richards TB, Berkowitz Z, Thomas CC, Foster SL, Gardner A, King JB, Ledford K, Royalty J.Choropleth map design for cancer incidence, part 1.Prev Chronic Dis. 2010; 7: A23. Epub 2009.
- Cromley RG, Cromley EK.Choropleth map legend design for visualizing community health disparities.Int J Health Geogr. 2009; 8: 52.
- Dasgupta S, Vaughan AS, Kramer MR, Sanchez TH, Sullivan PS. Use of a Google Map Tool Embedded in an Internet Survey Instrument: Is it a Valid and Reliable Alternative to Geocoded Address Data? JMIR Res Protoc. 2014; 3: e24.
- Kobayashi S, Fujioka T, Tanaka Y, Inoue M, Niho Y, et al. A geographical information system using the Google Map API for guidance to referral hospitals. J Med Syst. 2010; 34: 1157-1160.
- Fenner T, Harris M, Levene M, Bar-Ilan J. A novel bibliometric index with a simple geometric interpretation. PLoS One. 2018; 13: e0200098.
- Vavryčuk V. Fair ranking of researchers and research teams. PLoS One. 2018; 13: e0195509.
- Sekercioglu CH. Quantifying coauthor contributions. Science. 2008; 322: 371.
- Sahe José-Alain. Quality versus quantity: assessing individual research performance. Sci Transl Med. 2011; 3: 84-13.
- Chien TW, Wang HY, Chang Y, Kan WC. Using Google Maps to display the pattern of coauthor collaborations on the topic of schizophrenia: A systematic review between 1937 and 2017.Schizophr Res. 2018; S0920-9964; 30573-5.
- Chien TW, Chow JC, Chang Y, Chou W. Applying Gini coefficient to evaluate the author research domains associated with the ordering of author names: A bibliometric study.Medicine: September 2018; 97: e12418
- Ponikowski P, Voors A A, Anker S D, Bueno H, Cleland J G F, et al. Scientific Document Group (ESC). ESC Guidelines for the diagnosis and treatment of acute and chronic heart failure: The Task Force for the diagnosis and treatment of acute and chronic heart failure of the European Society of Cardiology (ESC) Developed with the special co9ntribution of the Heart Failure Association (HFA) of the ESC.Eur Heart J. 2016; 37: 2129-2200.
- Hirsch JE. An index to quantify an individual’s scientific research output. Proc Natl Acad Sci USA 2005;102:16569-72.
- Chien TW, Kan WC, Wang HY, Jen DH. Using Choropleth Maps to Show the Most Cited Articles and Authors on the Topic of Traditional Chinese Medicine from 2013 to 2017 in Pubmed Central.Chinese Traditional Medicine Journal. 2018; 1: 1-6.
- Hu SK, Huang J, Hong WD, Du XJ, Jin R, et al.The 50 Most-cited Articles in Gastroenterology and Hepatology from Mainland China.Pak J Med Sci. 2017; 33: 215-220
- Baghele ON, Malpani PS, Mohkhedkar AS.The 50 most cited manuscripts by Indian periodontists: a citation analysis of PubMed database.Oral Health Dent Manag. 2014; 13: 137-145.
- Sayed G. U-E-I-98: PET/CT’s Most-Cited 50 Articles since 2000: A Bibliometric Analysis of Classics. Med Phys. 2012; 39: 3647.
- Csako G. Analysis of the most highly cited articles from the 50-year history of CCA.Clin Chim Acta. 2007 ;375:43-48. Epub 2006.
- Jain R., Chiu D M, Hawe W R. A quantitative measure of fairness and discrimination for resource allocation in shared computer system. DEC Technical Report TR301 cs.NI/9809, 1984: 1-38.
- Huang MH, Chi PS. A comparative analysis of the application of h-index, g-index, and a-index in institutional-level research evaluation. Journal of Library and Information Studies 2010; 8: 1-10.
- Zhang CT. The h’-Index, Effectively Improving the h-Index Based on the Citation Distribution. PLoS ONE 2013; 8: e59912.
- Zhang CT. The e-index, complementing the h-index for excess citations.The e-index, complementing the h-index for excess citations. PLoS One 2009; 4: e5429.
- Hagen NT. Harmonic allocation of authorship credit: source-level correction of bibliometric bias assures accurate publication and citation analysis. PLoS One. 2008; 3: e4021.
MedDocs Publishers
We always work towards offering the best to you. For any queries, please feel free to get in touch with us. Also you may post your valuable feedback after reading our journals, ebooks and after visiting our conferences.


