Annals of Cardiology and Vascular Medicine
HOME /JOURNALS/Annals of Cardiology and Vascular Medicine- Research Article
- |
- Open Access
The effects of partial sleep deprivation and the sub-maximal NDKS exercise testing protocol on S-Klotho and hemodynamic responses in men
- Saghiv M;
- Department of Exercise Physiology, University of Mary, Bismarck, ND, USA
- Backes B;
- Department of Exercise Physiology, University of Mary, Bismarck, ND, USA
- Cook K;
- Department of Exercise Physiology, University of Mary, Bismarck, ND, USA
- Frank S;
- Department of Exercise Physiology, University of Mary, Bismarck, ND, USA
- Schaaf J;
- Department of Exercise Physiology, University of Mary, Bismarck, ND, USA
- Wagner M
- Department of Exercise Physiology, University of Mary, Bismarck, ND, USA

| Received | : | May 24, 2018 |
| Accepted | : | Aug 01, 2018 |
| Published Online | : | Aug 03, 2018 |
| Journal | : | Annals of Cardiology and Vascular Medicine |
| Publisher | : | MedDocs Publishers LLC |
| Online edition | : | http://meddocsonline.org |
Cite this article: Saghiv M, Backes B, Cook K, Frank S, Schaaf J, Wagner M. The effects of partial sleep deprivation and the sub-maximal NDKS exercise testing protocol on S-Klotho and hemodynamic responses in men. Ann Cardiol Vasc Med. 2018; 2: 1006.
Abstract
Purpose: The purpose of the study was to examine the influences of partial sleep deprivation on young healthy trained men’s responses to the NDKS sub-maximal exercise testing protocol.
Methods: 20 males 21.6±1.82 years of age, volunteered to participate in this study. Subjects underwent two submaximal NDKS exercise tests, once after 7-8 hours of sleep, and once after staying awake for 20 hours. S-klotho, blood pressure, heart rate, fasting blood glucose, and Lactate were obtained at baseline, immediate-post, and post a dynamic recovery of 3 minutes.
Results: S-klotho at baseline was 430.31±12.62 (pg·mL-1). Significant differences were found between conditions regarding immediate-post s-klotho concentration (557.97±20.08 vs 494.85±11.57 (pg·mL-1), respectively, F(39,1) = 144.648, p ≤ 0.01). Significant differences were found between conditions regarding post-recovery s-klotho concentration (453.29±4.34 vs 471.48±8.89 (pg·mL-1), respectively, F (39,1) = 64.146, p ≤ 0.01).
Conclusion: while not all comparisons for data obtained were significantly different, partial sleep deprivation induced favorable responses while non-partially sleep deprived. All data show that while partially sleep deprived, the subjects were less efficient.
Keywords: Partial sleep deprivation; S-klotho; NDKS; Hemodynamic responses; Exercise testing; Blood pressure; Glucose; Lactate; Heart rate; Rate of perceived exertion
Introduction
It has long been known that different extents of sleep deprivation (partial and/or full) have negative implications on function, hemodynamic, and physiological responses [1-6]. The influences of sleep deprivation may in some cases, be sex-specific (male vs female). Such influences may be characterized by neurologic, endocrine, physiologic-metabolic, and behavioral changes, often for worse [7-9].
Prior studies pertaining to the influences of sleep deprivation of different extent clearly indicate that while sleep deprived, multiple aspects of function, across several systems are influenced for the worse. Such influences may include endothelial dysfunction, hypertension, decreased brain activity, cardiac dysfunction, heart rate variability, arrhythmias, blood pressure, renal function, and more [10-13].
On the other hand, exercise and adaptation to exercise of various exercise modalities such as aerobic training, and resistance training has been proven to negate part and/or all of the adverse effects of sleep deprivation in humans and rats [14- 17].
Klotho is an enzyme that in humans is encoded by the KL gene [18]. S-klotho is a type I membrane protein first documented in 1997 [19]. The protein is associated with the degenerative process, acceleration of aging, bone lose, and alcohol consumption [20-24]. Furthermore, s-klotho is a role-player in determining the sensitivity to Insulin, mediates the binding of FGF19, FGF20, and FGR23 to their receptors as part of the growth process at the cellular level [23].
In addition, S-klotho is suggested as a cardiovascular system “protector” via means of endothelium-derived NO production [25-26]. S-klotho has been proven to affect cellular Calcium homeostasis via increased expression of TRPV5, and decreased TRPC6; and increases membrane expression of Inward Rectifier ROMK; in mice, under-expression causes hypervitaminosis of Vitamin D; altered mineral-ion homeostasis resulting in accelerated aging; a syndrome of accelerated aging; arteriosclerosis; impaired endothelium-dependent vasodilation; and impaired angiogenesis [23, 27-30].
Over-expressionmay prolong life span by 19-31% (in mice). In humans, exercise modalities influence klotho gene expression epigenetically and positively [31]. Prior studies show improvements in aerobic capacity, exercise tolerance, and power output [32-33].
To the best of the authors’ knowledge, no prior published data exists as to the influence of partial (less than 40 hours of lack of sleep) and/or full sleep deprivation (more than 40 hours of lack of sleep) on s-klotho in humans and/or during and after an exercise test of any sort. Thus, the aim of this study was to investigate the influences of partial sleep deprivation (20 hours of lack of sleep) on s-klotho concentration (pg·mL-1), heart rate (bpm), blood pressure (mmHg), fasting blood glucose (mg∙dL-1), Lactate (mmol∙L-1), Oxygen saturation (O2 sat, %) and rate of perceived exertion (RPE, Scale) before and after a Nustad, Dressler, Kobes, Sagiv (NDKS) sub-maximal exercise testing protocol in young, healthy, and trained men.
Methods
Overview, subjects, recruitment and enrollment
After achieving Institutional Review Board (IRB) approval to conduct this study, students at the University of Mary, Bismarck, ND, USA, were asked to participate in the study. Twenty males, 21.6±1.82 years of age, volunteered to participate in this study. All participants were healthy and trained individuals.
Subjects visited with the researcher 3-4 times. Upon agreeing to participate, subjects received an informed consent form via email and/or hard-copy, read the form, and indicated in a clear manor they have fully understood its content, prior to signing the form. The subjects were given as many opportunities as needed and/or wanted to ask questions pertaining to the study’s purpose, protocol, etc.
Subjects then filled-out a Health History Questionnaire (HHQ) and signed the HHQ. The information in the HHQ and followup questions (if raised) were used to determine rather or not a specific prospective subject were to be included or excluded from the study. Prospective subjects were excluded if they had diagnosed musculoskeletal injury, cardiovascular disease, pulmonary disease, mental health problems, endocrine instability, and/or were treated with medication for any reason.
Baseline measurements
Following inclusion in the study (as part of the first visit with the researchers), the subjects ’heart rate, blood pressure, O2 sat, fasting blood glucose, blood lactate, and a 5mL blood sample (from the Median Cubital Vein) were obtained, recorded on file and/or labeled. Prior to leaving the lab, subjects were randomly assigned to their two sub-maximal NDKS exercise tests. Using a table of random numbers, half of the subjects were assigned to be tested Non-partially Sleep Deprived first (NSD), and the other half, scheduled to be tested Partially Sleep Deprived first (PSD). Subject were allowed to leave the lab in the absence of adverse reactions and/or return to baseline values.
Prior to exercise testing sessions
Subjects were instructed to completely avoid alcohol consumption of any sort, moderate/intensive exercise of any sort, caffeine, use of any over-the-counter medications, and/or stressful situations at least 8 hours prior to data collection. Subjects self-reported their compliance with these instructions.
Exercise testing (NSD or PSD)
Subjects tested while partially sleep deprived, reported to the lab in 30-minute increments starting at 2am (up to six subjects were tested per data collection session; two at a time, and no more than three pairs altogether). Subjects were instructed to be completely awake from 6am the prior day. Subjects were contacted via email, text message, and/or phone call the day before testing to assure compliance with the instructions.
Subjects tested while non-partially sleep deprived, reported to the lab in 30-minute increments starting at 6am (up to six subjects were tested per data collection session; two at a time, and no more than three pairs altogether). Subjects were instructed to sleep 7.5-8 hours prior to testing. Subjects contacted via email, text message, and/or phone call the day before testing to assure compliance with the instructions.
Upon arrival at the lab, the subjects were asked if they have complied with the instructions (one after the other). Subjects non-compliant with the instructions were rescheduled; all subjects were tested twice within a period of no more than two weeks in between test, and for the vast majority of cases, within a week a part.
Subjects complaint and without signs of a health condition (cold, influenza, etc.) were seated for 5 minutes, doing nothing. Afterwards, Heart rate, and blood pressure were obtained and compared to the subject’s baseline values. The subject then continues to a warm up, followed by a NDKS sub-maximal exercise test (see appendix A for actual protocol), and dynamic recovery following the test itself. The exercise test was terminated once the subjects achieved 85% of his age-estimated maximal heart rate according to the equation [HR85% = 0.85×(220-age)] or if the subject wished so for any reason. Heart rate, blood pressure, RPE (6-20 scale), and O2 sat were obtained every other minute during the exercise test (see appendix A). S-klotho was obtained after subjects returned to resting heart rate and blood pressure values post-dynamic recovery that included waking at 1.7 miles per hour at 0% grade.
Samples and measurements
5mL blood samples were obtain (according to universal precautions for blood borne pathogens) from the Median Cubital Vein and stored in BD Vacutainer™ Venous Blood Collection Tubes: SST™ Serum Separation Tubes with Conventional Stopper until analyzed; samples were then refrigerated.
Subject without adverse reactions and upon return to the vicinity of baseline values were allowed to leave the lab.
Blood samples were analyzed via Soluble Klotho (Human serum) ELISA Kit SK00708-08 (Adipo Bioscience, Inc.), with a Standard range of 313-20000 pg∙mL-1; Sensitivity of 80 pg∙mL-1; Intra-CV of 4-6%; and Inter-CV of 8-10%. Blood pressure was obtained utilizing an Omron sphygmomanometer; heart rate via FS1 Polar Heart Rate Monitor and strap, Oxygen saturation was obtained via Oxywatch C20 ChoiceMMed pulse-oximeter; Lactate and glucose (mg∙dL-1) were obtained via Point-of-Care Testing using a Nova Biomedical Lactate Plus meter and a Health Mart True Metrix meter respectively. The treadmill used in this study was a SportsArt Fitness 6320.
Statistical analysis
SPSS 23 for Windows was used to analyze the data, Comparisons between conditions (partial sleep deprivation vs non-partial sleep deprivation) were conducted via One-way repeated measures ANOVA and the Tukey post hoc test. Significance was set at p < 0.05. Results are presented as means ± standard deviation, F values when appropriate.
Results
In general
All subjects participated in this study without any prolonged adverse reactions. Some subjects had a temporary reaction to their blood being drawn (dizziness, elevated heart rate, hypertension, hypotension, and in two cases subjects reacted with syncope). All subjects left the lab without any adverse clinical signs.
Baseline measures
All comparisons, regardless of condition, between immediate-post and post-dynamic recovery concentrations and baseline concentration of s-klotho were significant (p≤0.05). All possible comparisons pertaining to measures of Glucose were statistically non-significant (p>0.05). Comparisons between conditions of peak heart rate, systolic blood pressure, diastolic blood pressure, rate of perceived exertion, and oxygen saturation, were all non-significant (p>0.05).
Heart rate at baseline was 66.5±7.34 bpm, while systolic blood pressure was 118.9±8.09 mmHg and diastolic blood pressure was 68.4±9.05 mmHg. Baseline Glucose was 104.95±17.81mg∙dL-1, Lactate was 2.09±1.26 mmol∙L-1, and oxygen saturation was at 97.79±0.89%. Data for heart rate, blood pressure, glucose, lactate, and oxygen saturation are presented in table 1.
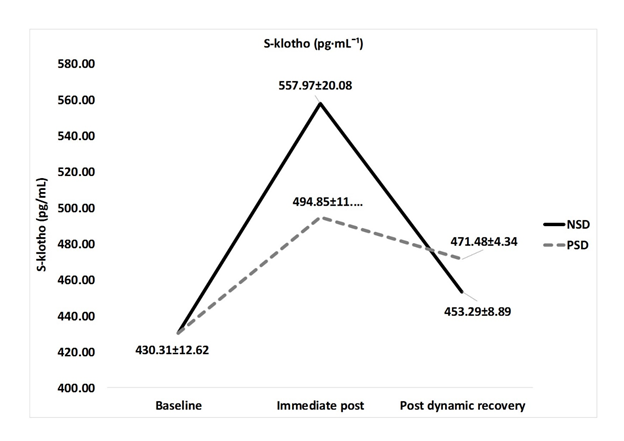
S-klotho
S-klotho concentration at baseline was 430.31±12.62 (pg·mL-1). In the absence of sleep deprivation (NSD), s-klotho concentrations increased to 557.97±20.08 immediate post (85% of age-estimated heart rate maximum). S-klotho concentrations then decreased to 453.29±4.34 post dynamic recovery. Significant differences were found between s-klotho concentration at baseline compared to immediate post [430.31±12.62 vs 557.97±20.08pg·mL-1, respectively, F(39,1) = 144.648, p ≤ 0.01]. While the difference in s-klotho concentrations were significant in comparison between immediate post and post-dynamic recovery [557.97±20.08 vs 453.29±4.34 pg·mL-1, respectively, F(39,1) = 123.75, p ≤ 0.01], no significant difference was found in comparison between resting values and post-dynamic recovery levels [430.31±12.62 vs 453.29±4.34 pg·mL-1, respectively, F(39,1) = 8.12, p ≥ 0.05] while non-sleep deprived.
Under Partial Sleep Deprivation (PSD), s-klotho concentrations increased from 430.31±12.62 to 494.85±11.57 pg·mL-¹ immediate post. Following dynamic recovery, s-klotho decreased to 471.48±8.89 pg·mL-1. A significant difference was found between s-klotho concentration at baseline and immediate post [430.31±12.62 vs 494.85±11.57 pg·mL-1, respectively, F(39,1) = 45.52, p ≤ 0.05]. The comparison between baseline concentration and post-dynamic recovery concentration yield a significant difference as well [430.31±12.62 vs 471.48±8.89 pg·mL-1, respectively, F(39,1) = 38.99, p ≤ 0.05]. A non-significant difference was found between s-klotho concentrations immediatepost and post-dynamic recovery [494.85±11.57 vs 471.48±8.89 pg·mL-1, respectively, F(39,1) = 13.02, p ≥ 0.05].
A Significant differencewas found between conditions (NSD vs PSD) regarding immediate-post s-klotho concentration [557.97±20.08 vs 494.85±11.57 pg·mL-1, respectively, F(39,1) = 187.75, p ≤ 0.01], and a non-significant difference between conditions regarding post-recovery s-klotho concentration [453.29±4.34 vs 471.48±8.89 pg·mL-1, respectively, F(39,1) = 6.33, p ≥ 0.05]. Dynamics of s-klotho concentration are presented in table 2 and figure 1 below.
Figure 1: S-klotho (pg·mL -1 ) concentrations according to condition (mean±SD).
NSD: Non-Sleep Deprived; PSD: Partially Sleep Deprived
Heart rate
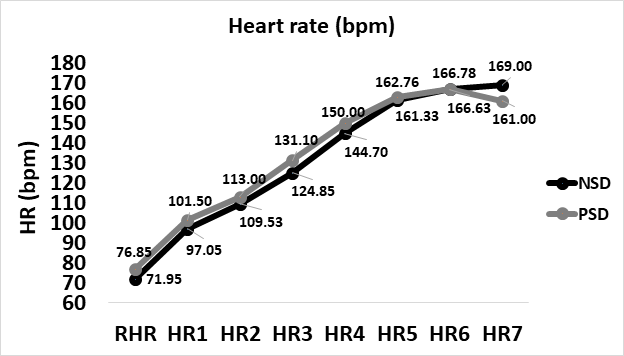
From baseline to peak heart rate (at 85% of age-estimated maximal heart rate), heart rate increased from 66.5±7.34 to 166.25±8.59 bpm while non-sleep deprived, and from 66.5±7.34 to 168.35±2.23 bpm while partially sleep deprived. No significant difference was found between peak heart rates in comparison between NSD and PSD conditions [166.25±8.59 vs 168.35±2.23bpm, respectively, (F(39,1) = 3.4, p ≥ 0.05]. Changes in heart rate according to the stage of the NDKS sub-maximal test are presented in figure 2.
Figure 2: Changes in heart rate (bpm) according to condition, during the sub-maximal NDKS exercise test (mean).
HR: Heart Rate; BPM: Beats Per Minute; RHR: Resting Heart Rate; NSD: Non-Sleep Deprived; PSD: Partially Sleep Deprived
Systolic blood pressure
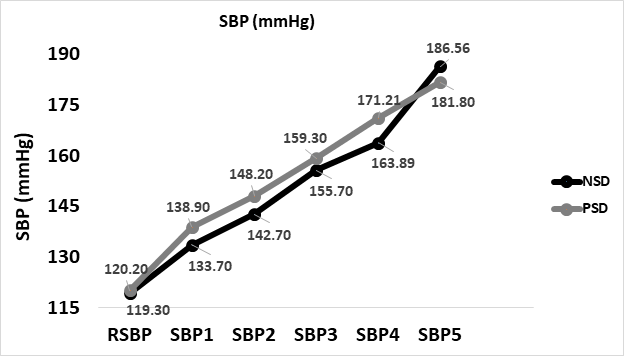
Systolic blood pressure increased from 118.9±8.09 at baseline to 172.40±23.42mmHg at peak while non-sleep deprived, and 177.25±13.44mmHg while non-sleep deprived. No significant difference was found between peak systolic pressures in comparison between NSD and PSD conditions [172.40±23.42 vs 177.25±13.44mmHg, respectively, (F(39,1) = 6.1, p ≥ 0.05]. Changes in systolic blood pressure according to the stage of the NDKS sub-maximal test are presented in figure 3.
Figure 3: Changes in systolic blood pressure (mmHg) according to condition, during the sub-maximal NDKS exercise test (mean).
SBP: Systolic Blood Pressure; RSBP: Resting Systolic Blood Pressure; mmHg: Millimeters Of Mercury; NSD: Non-Sleep Deprived; PSD: Partially Sleep Deprived; Blood pressure not measured while running
Diastolic blood pressure
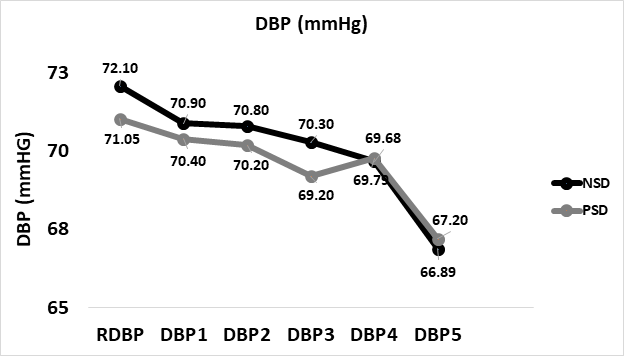
Diastolic blood pressure increased from 68.4±9.05 at baseline to 75.20±7.12mmHg at peak while non-sleep deprived, and 75.75±7.41mmHg while non-sleep deprived. No significant difference was found between peak diastolic pressures in comparison between NSD and PSD conditions [75.20±7.12vs 75.75±7.41mmHg, respectively, (F(39,1) = 1.3, p ≥ 0.05]. Changes in systolic blood pressure according to the stage of the NDKS sub-maximal test are presented in figure 4.
Figure 4: Changes in diastolic blood pressure (mmHg) according to condition, during the sub-maximal NDKS exercise test (mean).
DBP: Diastolic Blood Pressure; RDBP: Resting Diastolic Blood Pressure; mmHg: Millimeters Of Mercury; NSD: Non-sleep Deprived; PSD: Partially Sleep Deprived; Blood pressure not measured while running
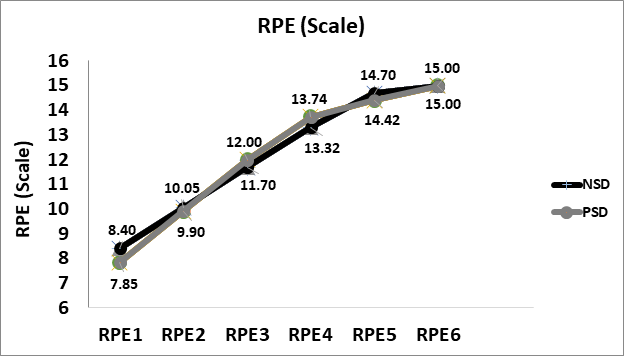
RPE
Peak rate of perceive exertion (scale of 6-20) was14.60±1.88 while non-sleep deprived, and 14.80±1.74 while partially sleep deprived. No significant difference was found between peak RPE in comparison between NSD and PSD conditions [14.60±1.88vs 14.80±1.74, respectively, (F(39,1) = 0.93, p ≥ 0.05]. Changes in rate of perceived exertion according to the stage of the NDKS sub-maximal test are presented in figure 5.
Figure 5: Changes in rate of perceived exertion (RPE; Scale) according to condition (mean).
RPE: Rate or Perceived Exertion; NSD: Non-Sleep Deprived; PSD: Partially Sleep Deprived
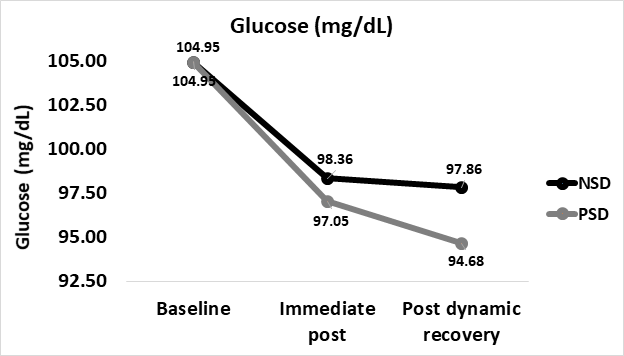
Glucose
Glucose concentrations decreased from 104.95±17.81 mg∙dL-1 at baseline in both NSD and PSD immediate post (98.36±25.92 vs 97.05±16.67 mg∙dL-1, respectively). No significant difference was found between immediate-post glucose in comparison between NSD and PSD conditions [98.36±25.92vs 97.05±16.67 mg∙dL-1, respectively, (F(39,1) = 1.24, p ≥ 0.05].
Researchers noted further decreases in the transition from immediate-post to post-dynamic recovery in both NSD and PSD conditions (97.86±26.94 vs 94.68±14.45 mg∙dL-1, respectively). No significant difference was found between post-dynamic recovery glucose in comparison between NSD and PSD conditions [97.86±26.94 vs 94.68±14.45 mg∙dL-1, respectively, (F(39,1) = 8.74, p ≥ 0.05].
Immediate-post Glucose while non-sleep deprived and while partially sleep deprived were found to be significantly lower in comparison to baseline [104.95±17.81 vs 98.36±25.92 mg∙dL-1, respectively, (F(39,1) = 32.13, p ≤ 0.05], [104.95±17.81 vs 97.05±16.67mg∙dL-1, respectively, (F(39,1) = 36.81, p ≤ 0.05] respectively.
Post-dynamic recovery Glucose while non-sleep deprived and while partially sleep deprived were found to be significantly lower in comparison to baseline [104.95±17.81 vs 97.86±26.94mg∙dL-1, respectively, (F(39,1) = 34.01, p ≤ 0.05], [104.95±17.81 vs 94.68±14.45mg∙dL-1, respectively, (F(39,1) = 42.66, p ≤ 0.05] respectively. Post-recovery levels were insignificantly lower than those immediate-post for both NSD and PSD conditions [97.86±26.94 vs 98.36±25.92 mg∙dL-1, respectively, (F(39,1) = 6.74, p ≤ 0.05], [94.68±14.45 vs 97.05±16.67mg∙dL-1, respectively, (F(39,1) = 16.02, p ≥ 0.05] respectively. Changes in fasting blood glucose according to the stage of the NDKS submaximal test are presented in figure 6.
Figure 6: Changes in Glucose (mg∙dL-1 ) according to condition (mean).
mg/dL: Milligrams Per Deciliter; NSD: Non-Sleep Deprived; PSD: Partially Sleep Deprived
lactate
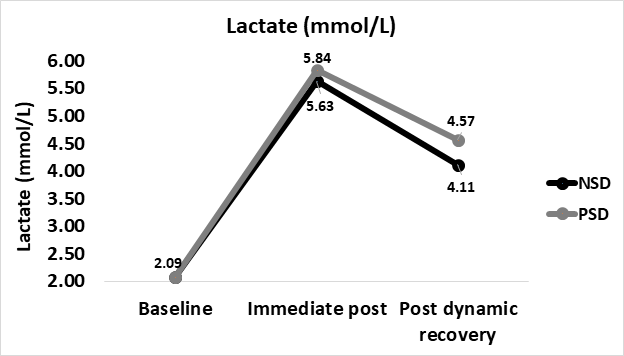
Lactate concentrations increased from 2.09±1.26mmol∙L-1 at baseline in both NSD and PSD immediate post (5.63±2.6 vs 5.84±2.29mmol∙L-1, respectively). No significant difference was found between immediate-post lactate in comparison between NSD and PSD conditions [5.63±2.6 vs 5.84±2.29mmol∙L-1, respectively, (F(39,1) = 5.64, p ≥ 0.05].
Lactate decreased in the transition from immediate-post to post-dynamic recovery in both NSD and PSD conditions (4.12±2.43 vs 4.57±3.66mmol∙L-1, respectively). No significant difference was found between post-dynamic recovery lactate in comparison between NSD and PSD conditions [4.12±2.43 vs 4.57±3.66mmol∙L-1, respectively, (F(39,1) = 13.5, p ≥ 0.05].
Immediate-post lactate while non-sleep deprived and while partially sleep deprived were found to be significantly higher in comparison to baseline [2.09±1.26 vs 5.63±2.6mmol∙L-1, respectively, (F(39,1) = 72.33, p ≤ 0.01], [2.09±1.26 vs 5.84±2.29 mmol∙L-1, respectively, (F(39,1) = 83.81, p ≤ 0.01] respectively.
Post-dynamic recovery lactate while non-sleep deprived and while partially sleep deprived were found to be significantly higher in comparison to baseline [2.09±1.26 vs 4.12±2.43mmol∙L-1, respectively, (F(39,1) = 102.0, p ≤ 0.01], [2.09±1.26 vs 4.57±3.66mmol∙L-1, respectively, (F(39,1) = 104.66, p ≤ 0.01] respectively. Post-recovery levels were significantly lower than those immediate-post for both NSD and PSD conditions [4.12±2.43 vs 5.63±2.6 mmol∙L-1, respectively, (F(39,1) = 66.74, p ≤ 0.05], [4.57±3.66 vs 5.84±2.29 mmol∙L-1, respectively, (F(39,1) = 66.02, p ≤ 0.05] respectively. Changes in blood lactate according to the stage of the NDKS sub-maximal test are presented in figure 7.
Figure 7: Changes in Lactate (mmol∙L-1) according to condition (mean).
mmol/L: Millimole Per Liter; NSD: Non-Sleep Deprived; PSD: Partially Sleep Deprived
Oxygen saturation
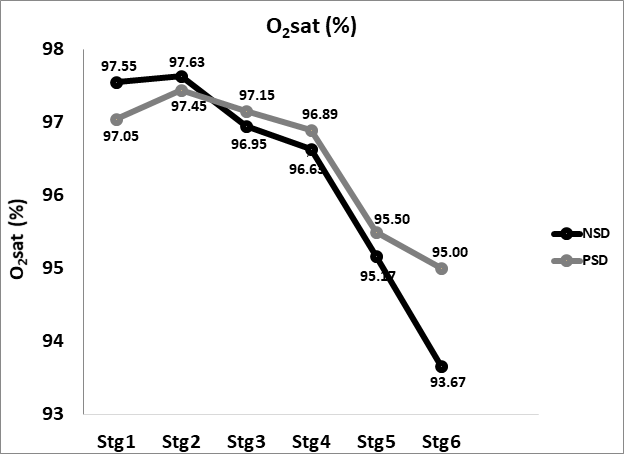
Oxygen saturation decreased from 97.79±0.89% at baseline in both NSD and PSD immediate-post (93.67±2.08 vs 95.5±1.98%, respectively). No significant difference was found between immediate-post oxygen saturation in comparison between NSD and PSD conditions [93.67±2.08 vs 95.5±1.98 %, respectively, (F(39,1) = 7.86, p ≥ 0.05].
Oxygen saturation increased in the transition from immediate-post to post-dynamic recovery in both NSD and PSD conditions (97.1±0.91 vs 96.37±1.34%, respectively). No significant difference was found between post-dynamic recovery oxygen saturation in comparison between NSD and PSD conditions [97.1±0.91 vs 96.37±1.34 %, respectively, (F(39,1) = 8.5, p ≥ 0.05].
Immediate-post oxygen saturation while non-sleep deprived and while partially sleep deprived were found to be insignificantly lower in comparison to baseline [93.67±2.08 vs 97.79±0.89%, respectively, (F(39,1) = 12.33, p ≥ 0.05], [95.5±1.98 % vs 97.79±0.89%, respectively, (F(39,1) = 8.81, p ≥ 0.05] respectively.
Post-dynamic recovery oxygen saturation while non-sleep deprived and while partially sleep deprived were similar to that of baseline [97.1±0.91 vs 97.79±0.89 %, respectively, (F(39,1) = 7.23, p ≥ 0.05], [96.37±1.34 vs 97.79±0.89 %, respectively, (F(39,1) = 8.66, p ≥ 0.05] respectively. Post-recovery levels were insignificantly higher than those immediate-post for both NSD and PSD conditions [97.1±0.91 vs 93.67±2.08%, respectively, (F(39,1) = 11.74, p ≥ 0.05], [96.37±1.34 vs 95.5±1.98%, respectively, (F(39,1) = 9.02, p ≥ 0.05] respectively. Changes in oxygen saturation according to the stage of the NDKS sub-maximal test are presented in figure 8.
Discussion
This study is a first of a kind in regards to partial sleep deprivation and its influences on s-klotho levels in men before and after sub-maximal exercise testing in men. The researchers are unaware of published data pertain to the topic. With that said, s-klotho is a biomarker of aging and anti-aging alike, dependent on the extent of gene expression [32,33]. Thus, this study starts to shade light on the connection between partial sleep deprivation and aging/anti-aging as it is represented via s-klotho concentration under certain conditions. Sleep deprivation (acute and/or chronic) is well documented as an influencer of function and performance in both healthy and clinical populations, across sex and age to different extents [1-17].
The present study demonstrates a clear and significant influence of partial sleep deprivation on s-klotho responses to the sub-maximal NDKS exercise test in young, healthy, and trained men, while compared to being non-sleep deprived. The data of this study suggest that partial sleep deprivation of 20 hours, is a strong enough stressor, resulting in lower levels of s-klotho immediate-post, and post-dynamic recovery, while compared to those of the non-sleep deprived state.
Partially sleep-deprived, and from baseline to 85% of ageestimated heart rate maximum, subject were unable to elevate s-klotho levels, although the same subject were able to do so while non-sleep deprived. Though the design of the study does not allow proving the reason for this dynamic, it is the researchers’ suggestion that the inability to elevate s-klotho as much as while non-sleep deprived represents an impaired reaction, induced by fatigue.
Proper sleep has been indicated as an anti-oxidative factor [34,35]. On the other hand, exercise induces the creation of reactive oxygen species (ROSs) [36-38]. Thus, it is possible that the need to elevate s-klotho during exercise is partially in order to assist with the need to battle ROSs. The impaired responseis further apparent at post-dynamic recovery, whereas the level during non-sleep deprivation return almost completely to baseline, most likely indicating the ability to counteract ROSs better than while partially sleep deprived.
Baseline heart rate values for this group of participants were within the range of previously reported findings for age, training status, and sex matching subject. Saghiv et al. (2016) reported resting heart rate to be 68.7±9.3 bpm [39] while Papathanasiou et al. (2013) reported resting heart rate to be 66.3±6.1 bpm [40]. Both resting systolic and diastolic blood pressure values of the subjects in this study were within normal and healthy ranges [41].
Subjects’ average resting fasting blood glucose was within the glucose range considered to indicate being pre-diabetic (100-126 mg∙dL-1 ) [42]. While matching age, sex, and training status subjects have been found to be pre-diabetic [43], it has been reported that roughly 1.7% of men ages 20-30 years are pre-diabetic [43]. Thus, while it is theoretically possible that all of the current study’s subjects fell within that 1.7%, it is highly unlikely. It is for this reason suggested that the higher baseline glucose levels of the current study’s subjects are due to possible non-compliance with the pre-data session collection instructions.
Baseline lactate concentration was within the previously reported range at rest for sex, age, and training status (0.5-2.2 mmol∙L-1 ) [44].
Oxygen saturation measured via pulse-oximeter showed that subjects’ oxygenation levels were adequate and contradicted a diagnosis of hypoxemia [45]. These results are similar, yet slightly lower than those reported by [46] whereas oxygen saturation was 98.53±0.52%.
Subjects of this study have been tested in a sub-maximal treadmill exercise test, and have achieved greater heart rate peak values than previously reposted. Patrick et al. (2017) found no significant influence of sleep deprivation on peak heart rate in young, healthy, male students undergoing a sub-maximal cycling test (149±22 vs 146±20 bpm, p=0.079, respectively)in comparison to being non-sleep deprivedIn both studies, heart rate peak under partial sleep deprivation was insignificantly lower [1].
Patrick et al. (2017) additionally reported blood pressure peak post-exercise to be significantly different between conditions of sleep deprivation and non-sleep deprivation, whereas all other variable were not significantly different (135±12 vs 140±17 mmHg, p=0.012, respectively). While the results of Patrick et al. (2017) are statistically significant, the values achieved are significantly lower in comparison to this study’s values for heart rate peak. Both differences in pick heart rate and systolic blood pressure between the current study and those of Patrick et al. (2017) may be explained by the extent of active muscle mass involved and the cardiac output demanded (treadmill vs cycle ergometer) [1].
The findings of this study as they pertain to RPE contradict prior findings whereas sleep deprivation resulted in elevated RPE. An interesting finding of these studies is the fact that physiological measures where not significantly affected while RPE increased, perhaps hinting that the cognitive and psychological component outweighs the physiological aspect [2]. While RPE was higher while partially sleep deprived, the differences were not great enough to induce a statistical significance. Similar insignificant finding regarding RPE were reported by Partick et al (2017) [1].
Recent data suggests that Oxygen saturation is not significantly altered due to partial sleep deprivation during exercise testing. Such findings were reported while investigating the effects of two types of Partial Sleep deprivation (PSD) on biomarkers of muscle and cardiac injuries in response to acute intermittent exercise in professional athletes [4]. These findings align perfectly with the findings of this study.
Prior studies have shown that partial sleep deprivation has no significant effect on Glucose, yet 48 hours of sleep deprivation (full sleep deprivation) results in a 40% greater Insulin resistance level [5]. While this study did not investigate the influences of partial sleep deprivation on Insulin and/or Insulin resistance, the findings of this study align with those of prior studies as to the insignificant effects of partial sleep deprivation on fasting blood glucose levels [5].
Very few data exist regarding the influences of sleep deprivation on Lactate and/or Lactic Acid. The findings of this study contradict a previous report whereas partial sleep deprivation caused a significant increase in Lactate [6].
Conclusions
The data of this study suggest that partial sleep deprivation is a strong enough stimulus affecting s-klotho concentration in response to the sub-maximal NDKS aerobic exercise testing protocol. Our results further support the possibility of an impaired ability to elevate s-klotho as a result of sub-maximal exercise, and impaired ability to return to baseline levels post-dynamic recovery.
The results of this study fairly align with the majority of existing data pertaining to the lack of significant influences of partial sleep deprivation on physiological variables, all but RPE.
Acknowledgments
The authors wish to acknowledge and thank Dr. Jill Nustad, Exercise Physiology Department Chair, and Dr. Billie Madler, Graduate Nursing Chair, at the University of Mary, Bismarck, ND, for their role in data collection. Furthermore, the authors wish to thank the Department of Biology, University of Mary, Bismarck, ND.
References
- Patrick Y, Lee A, Raha O, Pillai K, Gupta S, Sethi S, et al. Effects of Sleep Deprivation on Cognitive and Physical Performance in University Students. Sleep Biol Rhythms. 2017; 15: 217-225.
- Alhola P, Polo-Kantola P. Sleep deprivation: Impact on Cognitive Performance. Neuropsychiatr Dis Treat. 2007; 3: 553-67.
- Myles WS. Sleep Deprivation, Physical Fatigue, and the Perception of Exercise Intensity. Med Sci Sports Exerc. 1985; 17: 580- 584.
- Mejri MA, Yousfi N, Hammouda O, Tayech A, Ben Rayana MC, Driss T, et al. One Night of Partial Sleep Deprivation Increased Biomarkers of Muscle and Cardiac Injuries duringAcute Intermittent Exercise. J Sports Med Phys Fitness. 2017; 57: 643-651.
- Benedict C, Vogel H, Jonas W, Woting A, Blaut M, Schürmann A, et al. Gut Microbiota and Glucometabolic Alterations in Response to Recurrent Partial Sleep Deprivation in Normal-Weight Young Individuals. Mol Metab. 2016; 5: 1175–1186.
- Mejri MA, Yousfi N, Mhenni T, Tayech A, Hammouda O, Driss T, et al. Does One Night of Partial Sleep Deprivation Affect the Evening Performance During Intermittent Exercise in Taekwondo Players?. J Exerc Rehabil. 2016; 12: 47–53.
- Rångtell FH, Karamchedu S, Andersson P, Liethof L, Olaya Búcaro M, Lampola L, et al. A Single Night of Sleep Loss Impairs Objective but not Subjective Working Memory Performance in a SexDependent Manner. J Sleep Res. 2018.
- Goldstein-Piekarski AN, Greer SM, Saletin J, Harvey AG, Williams LM, Walker MP. Sex, Sleep Deprivation, and the Anxious Brain. J Cogn Neurosci. 2017; 15: 1-14.
- Eichhorn N, Treede RD, Schuh-Hofer S. The Role of Sex in Sleep Deprivation Related Changes of Nociception and Conditioned Pain Modulation. Neuroscience. 2017.
- Jiang J, Gan Z, Li Y, Zhao W, Li H, Zheng JP, et al. REM Sleep Deprivation Induces Endothelial Dysfunction and Hypertension in Middle-Aged Rats: Roles of the eNOS/NO/cGMP Pathway and Supplementation with L-Arginine. PLoS One. 2017; 12.
- Khan MS. Aouad R. The Effects of Insomnia and Sleep Loss on Cardiovascular Disease. Sleep Med Clin. 2017; 12: 167-177.
- Thomas SJ, Calhoun D. Sleep, Insomnia, and Hypertension: Current Findings and Future Directions. J Am Soc Hypertens. 2017; 11: 122-129.
- Kamperis K, Hagstroem S, Radvanska E, Rittig S, Djurhuus JC. Excess Diuresis and Natriuresis during Acute Sleep Deprivation in Healthy Adults. Am J Physiol Renal Physiol. 2010; 299: 404-411.
- Rajizadeh MA, Esmaeilpour K, Masoumi-Ardakani Y, Bejeshk MA, Shabani M, Nakhaee N. Voluntary Exercise Impact on Cognitive Impairments in Sleep-Deprived Intact Female Rats. Physiol Behav. 2018.
- Zagaar M, Dao A, Alhaider I, Alkadhi K. Corrigendum to “Regular Treadmill Exercise Prevents Sleep Deprivation-Induced Disruption of Synaptic Plasticity and Associated Signaling Cascade in the Dentate Gyrus”. Mol Cell Neurosci. 2017.
- de Souza JFT. Dáttilo M, de Mello MT, Tufik S, Antunes HKM. High-Intensity Interval Training Attenuates Insulin Resistance Induced by Sleep Deprivation in Healthy Males. Front Physiol. 2017; 8: 992.
- Slutsky AB, Diekfuss JA, Janssen JA, Berry NT, Shih CH, Raisbeck LD, et al. The Effects of Low-Intensity Cycling on Cognitive Performance Following Sleep Deprivation. PhysiolBehav. 2017; 180: 25-30.
- Matsumura Y, Aizawa H, Shiraki-Iida T, Nagai R, Kuro-o M, Nabeshima Y. Identification of the Human Klotho Gene and its Two Transcripts Encoding Membrane and Secreted Klotho Protein. Biochem Biophys Res Commun.1998; 242: 626–630.
- Kuro-o M, Matsumura Y, Aizawa H, Kawaguchi H, Suga T, Utsugi T, et al. Mutation of the Mouse Klotho Gene Leads to a Syndrome Resembling Ageing. Nature. 1997; 390: 45–51.
- Arking DE, Krebsova A, Macek M Sr, Macek M Jr, Arking A, Mian IS, et al. Association of Human Aging with a Functional Variant of Klotho. Proceedings of the National Academy of Sciences of the United States of America. 2002; 99: 856–861.
- Rodriguez T. Identifying Significant Biological Markers in Klotho Gene Variants Across Wide Ranging Taxonomy. J MolBiol Res. 2015; 5: 11.
- Xiao NM, Zhang YM, Zheng Q, Gu J. Klotho is a Serum Factor Related to Human Aging. Chin Med J (Engl). 2004; 117: 742–747.
- Huang CL. Regulation of Ion Channels by Secreted Klotho: Mechanisms and Implications. Kidney Int. 2010; 77: 855–860.
- Quintero-Platt G, González-Reimers E, Rodríguez-Gaspar M, Martín-González C, Pérez-Hernández O, Romero-Acevedo L, et al. Alpha Klotho and Fibroblast Growth Factor-23 Among Alcoholics. Alcohol Alcohol. 2017; 52: 542-549.
- . Saghiv M. et al. The Impact of 12 Weeks Exercise Training on Circulating Soluble-Klotho and Pro - BNP in Coronary Artery Disease Patients. J Cardiol Vasc Res. 2017; 1; 1-4.
- Chung CP, Chang YC, Ding Y, Lim K, Liu Q, Zhu L, et al. α-Klotho Expression Determines Nitric Oxide Synthesis in Response to FGF-23 in Human Aortic Endothelial Cells. PLoS One. 2017; 12: e0176817.
- Kuro-o M. Klotho and Aging. Biochimicaet Biophysica Acta. 2009; 1790: 1049–1058.
- Medici D, Razzaque MS, Deluca S, Rector TL, Hou B, Kang K, et al. FGF-23-Klotho Signaling Stimulates Proliferation and Prevents Vitamin D-Induced Apoptosis. J Cell Biol. 2008; 182: 459–465.
- Tsujikawa H, Kurotaki Y, Fujimori T, Fukuda K, Nabeshima Y. Klotho, A Gene Related to a Syndrome Resembling Human Premature Aging, Functions in a Negative Regulatory Circuit of Vitamin D Endocrine System. Mol Endocrinol. 2003; 17: 2393– 2403.
- Imura A, Tsuji Y, Murata M, Maeda R, Kubota K, Iwano A. AlphaKlotho as a Regulator of Calcium Homeostasis. Science. 2007; 316: 1615–1618.
- Dubal DB, Zhu L, Sanchez PE, Worden K, Broestl L, Johnson E, et al. Life Extension Factor Klotho Enhances Cognition. Cell Rep. 2014.
- Saghiv M. Circulating Soluble-Klotho and IGF-I Responses to Different Exercise Modalities in Young, Elderly and CAD Patients. Cardiol&Cardiovasc Ther. 2017; 4.
- Saghiv M, Sherve C, Ben-Sira D, Sagiv M, Goldhammer E. Aerobic Training Effect on Blood S-Klotho Levels in Coronary Artery Disease Patients. Clin Exp Cardiolog. 2016; 7: 8.
- Villafuerte G, Miguel-Puga A, Rodríguez EM, Machado S, Manjarrez E, Arias-Carrión O. Sleep Deprivation and Oxidative Stress in Animal Models: ASystematic Review. Oxid Med Cell Longev. 2015; 234952.
- Lungato L, Marques MS, Pereira VG, Hix S, Gazarini ML, Tufik S, et al. Sleep Deprivation Alters Gene Expression and Antioxidant Enzyme Activity in Mice Splenocytes. Scand J Immunol. 2013; 77: 195-199.
- Morton AB, Mor Huertas A, Hinkley JM, Ichinoseki-Sekine N, Christou DD, Smuder AJ. Mitochondrial Accumulation of Doxorubicin in Cardiac and Diaphragm Muscle Following Exercise Preconditioning. Mitochondrion. 2018.
- Centner C, Zdzieblik D, Dressler P, Fink B, Gollhofer A, König D. Acute Effects of Blood Flow Restriction on Exercise-Induced Free Radical Production in Young and Healthy Subjects. Free Radic Res. 2018; 16: 1-171.
- Trewin AJ, Berry BJ, Wojtovich AP. Exercise and Mitochondrial Dynamics: Keeping in Shape with ROS and AMPK. Antioxidants (Basel). 2018; 7.
- Saghiv M, Sagiv M, Ben Sira D, Goldhammer E. What Maintains Total Energy Release at Peak Anaerobic Effort in Young and Old Men?. ARC Journal of Research in Sports Medicine. 2016; 1: 4-8.
- Papathanasiou G, Georgakopoulos D, Papageorgiou E, Zerva E, Michalis L, Kalfakakou V. Effects of Smoking on Heart Rate at Rest and During Exercise, and on Heart Rate Recovery, in Young Adults. Hellenic J Cardiol. 2013; 54: 168-177.
- Whelton PK, Carey RM, Aronow WS, Casey DE Jr, Collins KJ, Dennison Himmelfarb C, et al. 2017 ACC/AHA/AAPA/ABC/ACPM/ AGS/APhA/ASH/ASPC/NMA/PCNA Guideline for the Prevention, Detection, Evaluation, and Management of High Blood Pressure in Adults. Hypertension. 2017.
- Hill NR, Oliver NS, Choudhary P, Levy JC, Hindmarsh P, Matthews DR. Normal Reference Range for Mean Tissue Glucose and Glycemic Variability Derived from Continuous Glucose Monitoring for Subjects Without Diabetes in Different Ethnic Groups. Diabetes Technol Ther. 2011; 13: 921–928.
- Pu-Yun, Su Z, Tang J, Lan X, Mao Y, Deng W, et al. Diabetes, Prediabetes and the Survival of Nasopharyngeal Carcinoma: A Study of 5,860 Patients. PLoS One. 2014; 9: e111073.
- GoodwinML, Harris JE, Hernández A, Gladden LB. Blood Lactate Measurements and Analysis during Exercise: AGuide for Clinicians”. Journal of Diabetes Science and Technology. 2007; 1: 558–569.
- Amal Jubran. Pulse Oximetry. Crit Care. 2015; 19: 272.
- Goldberg S, Buhbut E, Mimouni FB, Joseph L, Picard E. Effect of Moderate Elevation above Sea Level on Blood Oxygen Saturation in Healthy Young Adults. Respiration. 2012; 84: 207–211.
MedDocs Publishers
We always work towards offering the best to you. For any queries, please feel free to get in touch with us. Also you may post your valuable feedback after reading our journals, ebooks and after visiting our conferences.


