Annals of Cardiology and Vascular Medicine
HOME /JOURNALS/Annals of Cardiology and Vascular Medicine- Research Article
- |
- Open Access
- |
- ISSN: 2639-4383
Impact of Premature Ventricular Complexes on the QT Interval in Patients with Mitral Regurgitation
- Simon W Rabkin*;
- Faculty of Medicine, University of British Columbia, Vancouver, British Columbia, Canada.
- Eric Wong;
- Faculty of Medicine, University of British Columbia, Vancouver, British Columbia, Canada.
- Matthew T Bennett
- Faculty of Medicine, University of British Columbia, Vancouver, British Columbia, Canada.

| Received | : | Dec 27, 2020 |
| Accepted | : | Mar 15, 2021 |
| Published Online | : | Mar 18, 2021 |
| Journal | : | Annals of Cardiology and Vascular Medicine |
| Publisher | : | MedDocs Publishers LLC |
| Online edition | : | http://meddocsonline.org |
Cite this article: Rabkin SW, Wong E, Bennett WT. Impact of Premature Ventricular Complexes on the QT Interval in Patients with Mitral Regurgitation. Ann Cardiol Vasc Med. 2021: 4(1); 1048.
Keywords: QT interval; Premature ventricular complexes; QT heart rate adjustment formulae; Tp-e; PVC morphology.
Abstract
Objective: To Determine the Influence on Cardiac Repolarization, Assessed By QT Interval, Of Premature Ventricular Ectopics (PVC), which frequently occur in mitral regurgitation and can lead to fatal arrhythmias.
Method: Patients (N=20) with PVCs in the setting of mitral regurgitation with sinus rhythm had a detailed analysis of QT interval and PVC wave form. The QRS complex, on a 12 lead ECG, immediately before the PVC (-1) was compared to the first (+1) and second (+2) complex after the PVC.
Results: The QT interval was significantly longer in the two QRS complex after the PVC compared to QT-1. Tp-e (the interval from the peak to the end of the T wave), Tp-e/QT ratio and the QT interval correlated with the preceding RR interval (heart rate). After adjusting for heart rate, by the Bazett (QTcBZT) or Fridericia (QTcFRD) or spline (QTcRBK) correction approaches, only the first QT+1 was significantly prolonged. Tp-e and Tp-e/QT demonstrated heart rate dependence that was not seen with QT heart rate correction formulae. QT in the QRS complex+1 was mainly altered when the PVC had a RBBB configuration and a negative frontal plane axis consistent with an origin in the left ventricle.
Conclusion: PVCs can alter QT interval. The QT interval in the QRS complex immediately after a PVC should be excluded from assessment of QT interval. Heart rate adjusted QT formulae are preferable to using Tp-e interval. PVCs with RBBB and negative frontal plane QRS axis produce the greatest impact on QT interval.
Introduction
Assessment of the QT interval on the 12 lead ECG is an important indicator of cardiac repolarization and the potential for the development of significant cardiac arrhythmias that might be fatal [1,2]. Premature Ventricular Ectopics (PVCs) are also known to be a predictor of fatal cardiac arrhythmias and sudden death [3-5]. In a meta-analysis of 11 studies comprising 106,195 individual from general populations, frequent PVCs were associated with a substantial increase in the risk for sudden cardiac death and total cardiac deaths [5]. In animal models of heart failure both QT prolongation and ventricular arrhythmias underlie the development of sudden cardiac death [6].
PVCs have long been known to be associated with mitral regurgitation as identified in patients with isolated mitral valve disease from mitral valve prolapse [7,8]. The pathophysiology of PVCs in mitral valve prolapse and mitral regurgitation has been attributed to various factors and range from associated left ventricular dysynergy [9], traction on the papillary muscle [10], increased plasma catecholamines [11], prolongation of the QT interval [12] and changes in QT dispersion [13]. Of special concern in some forms of mitral regurgitation is the presence of PVCs originating from the posterior papillary muscle which may be associated with sudden cardiac death [14].
Accurate assessment of the QT interval in the presence of PVCs, is uncertain. Data from patients with chronic kidney disease undergoing hemodialysis suggest that PVCs alter the subsequent QT interval [15]. A PVC reportedly alters the form of the T wave not only for the first T wave after the PVC but for several more T waves as well [16]. This kind of change in T wave configuration would be anticipated to alter the currently accepted method to measure the QT interval which depends on identifying the end of the T wave by a tangential method using the form of the T wave from which the tangent is constructed from the T wave to the baseline. Other aspects of measurement of repolarization specifically the peak of the T wave to the end of the T wave (Tp-e) [17] and Tp-e/QT [18] ratio may be altered by a PVC, extrapolating from data on radiofrequency ablation of PVCs in patients with frequent PVCs [19].
The impact of PVCs on ventricular repolarization is of considerable importance because of the role that both independently play in genesis of potentially fatal ventricular arrhythmias. The objectives of this study were to examine PVCs in the setting of mitral regurgitation and to assess the impact of a PVC on the subsequent QT interval and to determine whether the characteristics of the PVC, its coupling interval, duration and its presumed site of origin, influence the subsequent QT interval.
Material and methods
Patient selection
Patients with mitral regurgitation were identified through a 2D echocardiography database. An Electrocardiogram (ECG) database was then used to select those patients who also had PVCs. The 12 lead ECGs were reviewed in detail and patients were included if they had at least one normal sinus complex before and two sinus complexes after a PVC and they did not have any of the exclusion criteria. The exclusion criteria were any of: (i) non-sinus rhythm or paced rhythm, (ii) presence of conduction disease (i.e. right or left bundle branch block), (iii) low T wave voltage or biphasic T-waves in more than 2 leads among V1-V3 so that the end of the T wave could not be well defined enough to measure the QT interval, (iv) presence of multiple PVCs (i.e. ventricular couplets or bigeminy pattern) which would preclude a steady state QT interval. The study had been approved by our Institution’s Ethics review committee.
Twenty patients with eligible ECGs were examined in detail. 12-lead ECGs were recorded digitally on Muse™ version 9.0 SP6 (General Electric, Boston, USA). The ECGs were viewed on a 10-second rhythm strip mode at 25mm/s paper speed. Digital calipers were used to measure RR intervals and QT intervals as well as the coupling interval. All complexes were examined using the magnification function and were done by one observer to reduce inter-observer variability. Validity of measurements was assessed by a second observer.
The RR interval and QT interval were measured in the QRS complexes of sinus origin before and after each QRS after the PVC in leads V1 to V3 (Figure 1). Measurement of the RR interval immediately before the QRS complex was used to adjust for the impact of heart rate on the QT interval. The RR interval was measured as the distance between the peak of the R-wave and the peak of the following R-wave. The QT interval was measured from the onset of the QRS complex to the end of the T wave which was defined using the tangent method. The QT interval was measured according to guidelines [20]. The Q to peak T wave was the interval from the onset of the QRS complex to the peak of the T wave. The Tp-e was the difference between the QT interval and the Q to peak T wave.
The characteristics of the PVC were defined. For each PVC, the coupling interval and QRS duration were measured in the precordial leads, V1-V3. The coupling interval was defined as the interval between the onset of the preceding sinus QRS complex (QT-1) and that of the PVC (Figure 1). The general location of the PVC is approximated by bundle branch morphology so PVCs were classified according to whether they displayed a right or left bundle branch pattern [21]. To further define the origin of the PVC, the frontal plane axis was assessed. The PVC characteristics were assessed by one observer and confirmed by another with differences being resolved by a third observer - electrophysiologist
Cardiac structure and function data were obtained from the Transthoracic Echocardiograms (TTE) closest to the date of the ECG. Left Ventricular Ejection Fraction (LVEF) were measured by American Society of Echocardiography standards [22]. The classification of the severity of mitral regurgitation from the TTE report was also noted. The echocardiographic assessments were done independent of the ECG analysis.
The QT interval can be adjusted for heart rate by several different formula. Three formulae were selected. First, the QT intervals were corrected for heart rate with the Bazett approach (QTcBZT) as well as the Frederica approach (QTcFRD) because both formulae are in widespread usage [23,24]. We used the new spline formula (QTcRBK) that was developed based on the ECGs from about 13,600 individuals in the NHANES US population study and was shown to be relatively independent of heart rate and superior to other QTc formulae [25]. Nomenclature for QTc abbreviations used the approach which specified the first three syllables of the first authors name [26].
Data analysis
The data are presented as the mean + 1 SD. The QT interval prior of the normal QRS complex immediately prior to the PVC (QT-1) was compared to the QT interval immediately after the PVC (QT+1) and the second normal sinus complex (QT+2) (Figure 1). Tests of significance used either ANOVA for non parametric data when there were more than two comparators or the t test using non parametric testing when there were only two variables when the data was paired (Wilcoxon sign test) or unpaired (GraphPad Prism version 7.0). The level of significance was set at the 5% level (p<0.05).
Results
The patient population was older with a mean age of 70 years and were predominantly men (Table 1). Fifty percent of the group had severe mitral regurgitation. In 45 % of cases the etiology of the mitral regurgitation was unknown, 40% of patients had ischemic heart disease (presumably the etiology of the PVCs) of whom 25% had a previous anterior MI and 25% had a previous inferior MI, 15% had mitral valve prolapse. The PVC configuration was a right bundle branch block configuration in the majority of cases suggesting a left ventricular origin of the PVC.
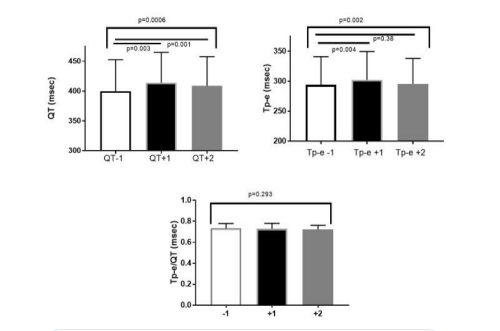
There was a significant overall difference (p=0.0006) in the QT intervals when assessing the QRS complex before the PVC to the QRS complex immediately after and the second complex after the PVC (Figure 2). There were significant differences (p<0.01) in the QT in the complex immediately following the PVC and in the QT of the second complex after the PVC compared to the QRS complex before the PVC.
There was a smaller but significant (p=0.002) difference in Tp-e when assessing the QRS complex before the PVC to the QRS complexes after the PVC. There was a significant (p=0.004) difference in Tp-e in the complex immediately following the PVC compared to the QRS complex before the PVC. The was no significant difference in Tp-e from the complex before to the second complex after the PVC.
The ratio of the Tp-e to the QT interval (Tp-e/QT) of the QRS complex before the PVC to each of the two QRS complexes after the PVC was not significantly different.
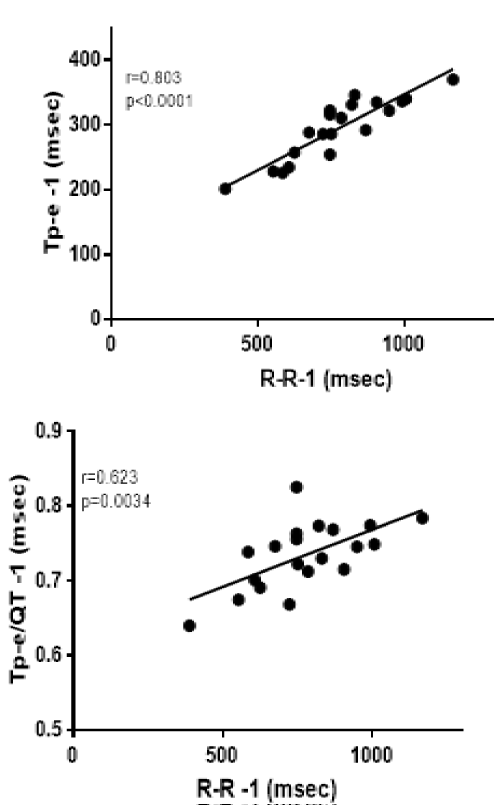
The effect of heart rate on the Tp-e and Tp-e/QT QT interval is shown by the significant association between the Tp-e and the RR interval in the QRS complex immediately before the PVC as there was a highly significant (p<0.0001) correlation between Tp-e and the RR interval immediately before the QRS complex before the PVC (Figure 3). There was also a significant (p=0.0034) correlation between Tp-e/QT and the RR interval immediately before the QRS complex before the PVC.
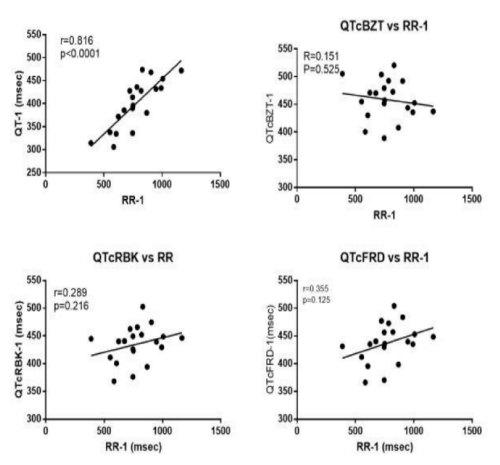
The dependency of the QT interval on heart rate is illustrated by the highly significant (p<0.0001) relationship between the QT interval and its preceding R-R interval (Figure 4). Each of three heart rate adjustment formulae remove the heart rate dependency.
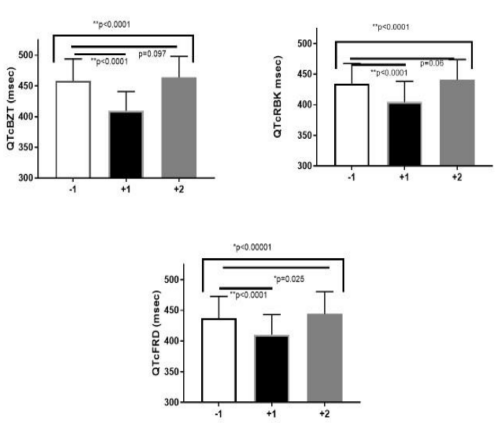
QTcBZT was significantly different in the normal sinus complex immediately after the PVC but was not significantly different in the second complex. (Figure 5) QTcRBK was significantly different in the normal sinus complex immediately after the PVC but was not significantly different in the second complex. QTcFRD was significantly different in the normal sinus complex immediately after the PVC as well as in the second complex after the PVC.
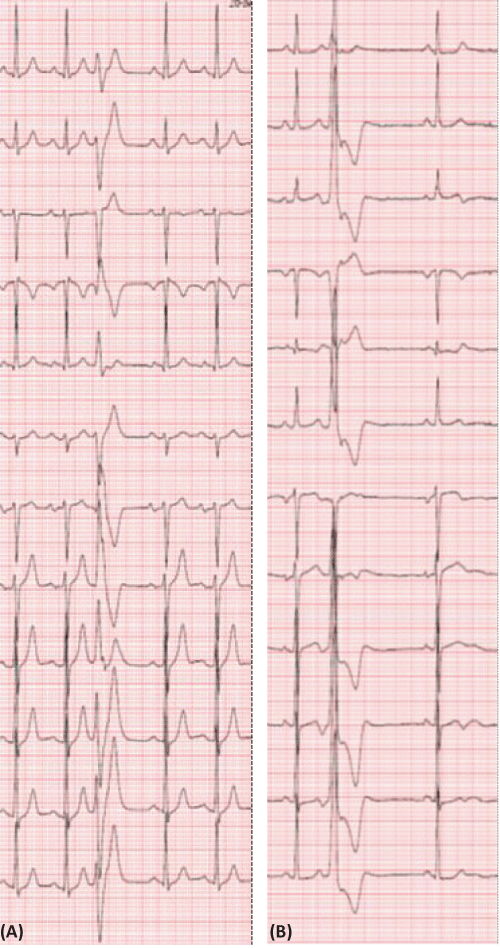
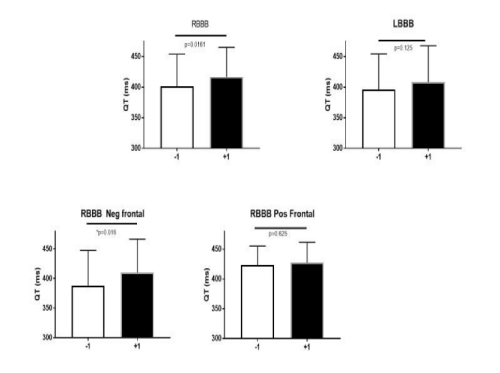
We next sought to determine whether the characteristics of the PVC influenced the QT interval. PVCs were categorized according to whether they had a right bundle branch block or left bundle branch block configuration (Figure 6 A and B respectively).There was a significantly longer QT interval when PVCs had a right bundle branch block configuration compared to PVCs with a left bundle branch block configuration (Figure 7). PVCs with a RBBB and negative frontal QRS axis (Figure 6 A) was the subset that had a significant greater QT duration from the first QRS complex before compared to the first QRS complex after the PVC. There was no significant differences in the coupling interval between the normal QRS and the PVCs with a RBBB configuration compared to a LBBB configuration (respectively 557 + 96 vs 490 + 77 msec; p= 0.204). There was no significant difference in duration of the PVC with a RBBB configuration compared to a LBBB configuration (respectively 153.8 + 33.6 vs 143.0 + 21.9 msec, p=0.656).
Figure 1: Shows an ECG with a premature ventricular ectopics in order to illustrate the QRS labelling in this study.
Figure 2: Shows the QT interval, T p-e interval and Tp-e/QT in the complex before the PVC (QT-1) and the first complex after the PVC (QT+1) and the second complex after the QT interval (QT+2).
Figure 3: Shows the relationship between the Tp-e and heart rate (RR interval) on the left and Tp-2/QT on the right panel in the first complex before the PVC.
Figure 4: Shows the relationship between the QT interval and heart rate (preceding RR interval in the first QRS complex before the PVC. In the absence of a heart rate correction and in three different formulae for heart rate correction namely QTcBZT. QTcRBK and QTcFRD.
Figure 5: Shows the QT interval, in the complex before the PVC (QT-1) and the first complex after the PVC (QT+1) and the second complex after the QT interval (QT+2) with heart rate correction using three different formulae for heart rate correction namely QTcBZT. QTcRBK and QTcFRD.
Figure 6: Shows an example of an ECG with a right bundle branch block configuration and a superior oriented frontal plane axis (A) and an ECG with a left bundle branch block configuration (B).
Figure 7: Shows the QT interval, in the complex before the PVC (QT-1) and the first complex after the PVC (QT+1) in PVCs with either a LBBB or RBBB configuration with the latter type being subdivided according to the frontal plane axis of the PVC.
Discussion
This study is an in-depth evaluation of the impact of a PVC on the QT interval in patients with mitral regurgitation and contributes novel data to factors affecting cardiac repolarization, a substrate for ventricular arrhythmias as well as to the assessment of QT interval measurement on the 12 lead ECG. We found that a PVC impacts the QT interval in the QRS complex immediately following the PVC. The impact of the PVC on the QT interval is not apparent by the second QRS complex. Some but not all QTc formulae eliminate the impact of the PVC on the second QRS complex. The study further determined that the measurement of Tp-e blunts but does not eliminate the impact of the PVC on the subsequent QT interval. Tp-e and Tp-e/QT show heart rate dependency, which limits their utility compared to a QT interval heart rate adjustment formula.
There is limited previous data on potential impact of a PVC on subsequent QRS complexes with respect to the QT interval. A study of 11 patients on hemodialysis, reported that the QT interval was prolonged in the QRS complex immediately following the PVC, but they did not apply any heart rate correction formulae or relate it to details of the PVC morphology [15]. PVCs induced during electrophysiologic stimulation of the right ventricle increase QT dispersion [27]. A study of 166 patients, of whom among half had no associated cardiovascular disorder, found that QT interval prolongation immediately after a ventricular ectopic beat was common, based upon ambulatory 24-hour Holter monitoring [28]. However, this study didn’t incorporate heart rate correction, or evaluate PVC morphology. Uslu et al studied patients before and after outflow tract PVC ablation and reported that PVCs ablation significantly deceased Tp-e and Tp-e/QT but not QT dispersion which was assessed using only the Bazett formula to adjust QT for heart rate [29]. Another study of catheter ablation of frequent PVCs reported that ablation significantly altered Tp-e interval, Tp-e/QT ratio and Tp-e/QTc [19]. Intervention procedures, however, may affect cardiac repolarization.
There are several limitations of the study that warrant discussion. The study has a relatively small sample size. This is in keeping with the need to identify a subset of individuals with both mitral regurgitation and PVCs, maintained in sinus rhythm. Patients with mitral regurgitation especially in severe disease, often have atrial fibrillation, which precluded them from the kind of analysis done in our study. Our sample size, however, was almost twice as large as a study of the effect of PVCs on QT interval in patients undergoing hemodialysis which is a highly unique population [15]. Second, the degree of mitral regurgitation and left ventricular function spanned a wide range. However, this range is the reality for patients with mitral regurgitation. Third, the impact of a PVC on subsequent QT interval was short. A high frequency of PVCs may produce a more sustained impact on cardiac repolarization [34]. Lastly, the mitral regurgitation was of mixed etiology and usually could not be delineated. This the often the case in patients with mitral regurgitation. However, the etiology and severity of mitral regurgitation is not relevant to the central purpose of this study namely to determine the effect of a PVC on the subsequent QT interval.
Conclusion
The study makes important contributions both to the field of cardiac repolarization which is a substrate for cardiac serious ventricular arrhythmias and also to clinical cardiology assessment of QT interval measurement on the 12 lead ECG. There are several novel findings. Firstly, it shows that the QT interval is affected by a PVC but that the effect is only evident for one complex if the heart rate is appropriated corrected by the preceding cycle length (RR interval). This finding has considerable relevance when QT intervals are automatically calculated by computer algorithms that do not include this adjustment. Second it shows that QT interval heart rate correction may be a preferable, at least simpler, assessment of cardiac repolarization that measurement of the Tp-e segment which has recently garnered much attention. Third it shows that the impact of a PVC to affect the QT interval is influenced by the site of origin of the PVC.
References
- Zhang Y, Post WS, Blasco-Colmenares E, Dalal D, Tomaselli GF, Guallar E. Electrocardiographic QT interval and mortality: A meta-analysis. Epidemiology. 2011; 22: 660-70.
- Poluzzi E, Raschi E, Koci A, Moretti U, Spina E, et al. Antipsychotics and torsadogenic risk: signals emerging from the US FDA Adverse Event Reporting System database. Drug Saf. 2013; 36: 467-79.
- Rabkin SW, Mathewson FAL, Tate RB. Relationship of ventricular ectopy in men without apparent heart disease to occurrence of ischemic heart disease and sudden death. Am Heart. J 1981; 101.
- Cheriyath P, He F, Peters I, Li X, Alagona PJ, et al. Relation of atrial and/or ventricular premature complexes on a two-minute rhythm strip to the risk of sudden cardiac death (the Atherosclerosis Risk in Communities [ARIC] study). Am J Cardiol. 2011; 107: 151-155.
- Ataklte F, Erqou S, Laukkanen J, Kaptoge S. Meta-analysis of ventricular premature complexes and their relation to cardiac mortality in general populations. Am J Cardiol. 2013; 112: 1263-1270.
- Cho JH, Zhang R, Aynaszyan S, Holm K, Goldhaber JI, et al. Ventricular Arrhythmias Underlie Sudden Death in Rats With Heart Failure and Preserved Ejection Fraction. Circ Arrhythm Electrophysiol. 2018; 11: e006452.
- Swartz MH, Teichholz LE, Donoso E. Mitral valve prolapse: a review of associated arrhythmias. Am J Med. 1977; 62: 3773389.
- DeMaria AN, Amsterdam EA, Vismara LA, Neumann A, Mason DT. Arrhythmias in the mitral valve prolapse syndrome. Prevalence, nature, and frequency. Ann Intern Med. 1976; 84: 656-660.
- Gooch AS, Vicencio F, Maranhao V, Goldberg H. Arrhythmias and left ventricular asynergy in the prolapsing mitral leaflet syndrome. Am J Cardiol. 1972; 29: 611-620.
- Gornick CC, Tobler HG, Pritzker MC, Tuna IC, Almquist A, et al. Electrophysiologic effects of papillary muscle traction in the intact heart. Circulation. 1986; 73: 1013-1021.
- Puddu PE, Pasternac A, Tubau JF, Krol R, Farley L,et al. QT interval prolongation and increased plasma catecholamine levels in patients with mitral valve prolapse. Am Heart J. 1983; 105: 422-428.
- Bekheit SG, Ali AA, Deglin SM, Jain AC. Analysis of QT interval in patients with idiopathic mitral valve prolapse. Chest. 1982; 81: 620-625.
- Kulan K, Komsuoglu B, Tuncer C, Kulan C. Significance of QT dispersion on ventricular arrhythmias in mitral valve prolapse. Int J Cardiol. 1996; 54: 251-257.
- Hourdain J, Clavel MA, Deharo J-C, Asirvatham S, Avierinos JF, et al. Common phenotype in patients with mitral valve prolapse who experience sudden cardiac death. Circulation. 2018; 138: 1067-1069.
- Vecchietti S, Langley P, Severi S, Cavalcanti S, Murray A. Effect of premature ventricular beats on manual and automatic repolarization measurements. J Electrocardiol. 2004; 37: 181-189.
- Lenis G, Baas T, Dossel O. Ectopic beats and their influence on the morphology of subsequent waves in the electrocardiogram. Biomed Tech (Berl). 2013; 58: 109-119.
- Kors JA, Ritsema van Eck HJ, van Herpen G. The meaning of the Tp-Te interval and its diagnostic value. J Electrocardiol. 2008; 41: 575-480.
- Gupta P, Patel C, Patel H, Narayanaswamy S, Malhotra B, et al. T(p-e)/QT ratio as an index of arrhythmogenesis. J Electrocardiol. 2008; 41: 567-574.
- Yayla C, Ozcan F, Aras D, Turak O, Ozeke O, et al. Tp-e interval and Tp-e/QT ratio before and after catheter ablation in patients with premature ventricular complexes. Biomark Med. 2017; 11: 339-346.
- Rautaharju PM, Surawicz B, Gettes LS, Bailey JJ, Childers R, et al. American Heart Association Electrocardi C on CCAC of CFHRS. AHA/ACCF/HRS recommendations for the standardization and interpretation of the electrocardiogram: Part IV: The ST segment, T and U waves, and the QT interval: A scientific statement from the American Heart Association Electrocardiography and Arrhythmias C. Circulation. 2009; 119: e241-50.
- Hutchinson MD, Garcia FC. An organized approach to the localization, mapping, and ablation of outflow tract ventricular arrhythmias. J Cardiovasc Electrophysiol. 2013; 24: 1189-1197.
- Lang RM, Badano LP, Mor-Avi V, Afilalo J, Armstrong A, et al. Recommendations for Cardiac Chamber Quantification by Echocardiography in Adults: An Update from the American Society of Echocardiography and the European Association of Cardiovascular Imaging. J Am Soc Echocardiogr. 2015; 28: 1-39.
- Bazett HC. An Analysis of the Time-Relations of Electrocardiograms. Heart. 1920; 7: 353-3570.
- Fridericia LS. The duration of systole in an electrocardiogram in normal humans and in patients with heart disease. 1920. Ann Noninvasive Electrocardiol. 2003; 8: 343-351.
- Rabkin S, Szefer E, Thompson DJS. A New QT Interval Correction Formulae to Adjust for Increases in Heart Rate. JACC Clin Electrophysiol. 2017; 3: 756-766.
- Rabkin SW, Cheng XB. Nomenclature, categorization and usage of Formulae to Adjust QT interval for Heart Rate. World J Cardiol. 2015; 7: 315-325.
- Day CP, McComb JM, Campbell RW. QT dispersion in sinus beats and ventricular extrasystoles in normal hearts. Br Heart J. 1992; 67: 39-41.
- Reiffel AJ, Reiffel JA. QT Prolongation Following Ectopic Beats: Initial Data Regarding The Upper Limit Of Normal With Possible Implications For Antiarrhythmic Therapy And Concealed (Unexpressed) Long QT. J Atr Fibrillation. 2009; 1: 113.
- Uslu A, Kup A, Gulsen K, Demir S, Kanar BG, et al. Acute effect of outflow tract premature ventricular complex ablation on QT dispersion, Tp-e interval and Tp-e/QT ratio. Acta Cardiol. 2020: 1-5.
- Doppalapudi H, Yamada T, McElderry HT, Plumb VJ, Epstein AE, Kay GN. Ventricular tachycardia originating from the posterior papillary muscle in the left ventricle: A distinct clinical syndrome. Circ Arrhythm Electrophysiol. 2008; 1: 23-29.
- Turker Y, Ozaydin M, Acar G, Ozgul M, Hoscan Y, et al. Predictors of ventricular arrhythmias in patients with mitral valve prolapse. Int J Cardiovasc Imaging. 2010; 26: 139-145.
- Wilde AA, Duren DR, Hauer RN, deBakker JM, Bakker PF, et al. Mitral valve prolapse and ventricular arrhythmias: Observations in a patient with a 20-year history. J Cardiovasc Electrophysiol. 1997; 8: 307316.
- Santoro F, Di Biase L, Hranitzky P, Sanchez JE, Santangeli P, et al. Ventricular fibrillation triggered by PVCs from papillary muscles: clinical features and ablation. J Cardiovasc Electrophysiol. 2014; 25: 1158-1164.
- Karaman K, Karayakali M, Arisoy A, Akar I, Ozturk M, et al. Is There any Relationship Between Myocardial Repolarization Parameters and the Frequency of Ventricular Premature Contractions?. Arq Bras Cardiol. 2018; 110: 534-541.
MedDocs Publishers
We always work towards offering the best to you. For any queries, please feel free to get in touch with us. Also you may post your valuable feedback after reading our journals, ebooks and after visiting our conferences.


